barChart
Gráfico de barras
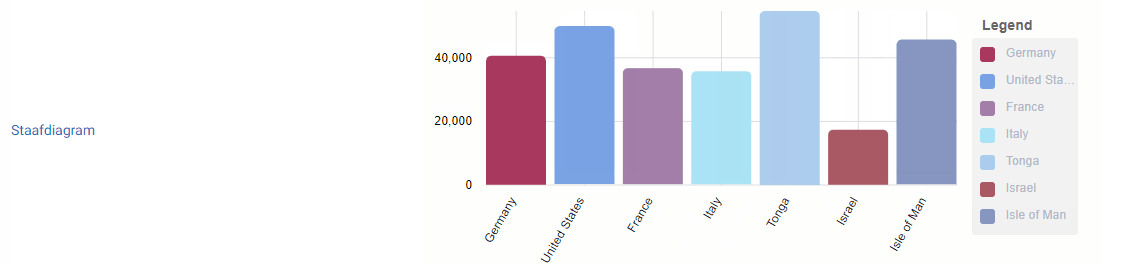
Este widget é usado para mostrar gráficos de barras.
Configurações
Gráfico ativo: Ativa o widget no painel de controle.
Expandir legenda: Isso aumenta o espaço sob o widget, permitindo que mais pontos de dados sejam visíveis sem uma barra de rolagem.
Posicionar legenda abaixo do gráfico: Isso posiciona a legenda abaixo do gráfico, caso seja desejado.
Visão empilhada: Isso irá empilhar as barras uma em cima da outra em vez de lado a lado.
Mostrar throbber. Você pode ativar isso se quiser ver o ícone de carregamento quando novos dados são enviados para o portal.
Título: Este é o título do widget.
Posição do widget: Esta é a posição do widget na lista do painel de controle.
Tamanho do widget: Isso determina se você deseja ver vários widgets lado a lado.
Para saber o que selecionar, você precisa ver o painel como 12 divisões. Aqui está uma lista para ver quantas divisões um tamanho ocupa:
-
XXL: Tamanho total/padrão; 12/12
-
XL: 10/12
-
L: 8/12
-
M: Metade; 6/12
-
S: 4/12
-
XS: 2/12
Período: Selecione qual é o período padrão quando o painel é carregado. Ex. Mês, para que quando você abrir o painel não precise editá-lo para que mostre dados de um mês.
